
Detective Assessment Probe
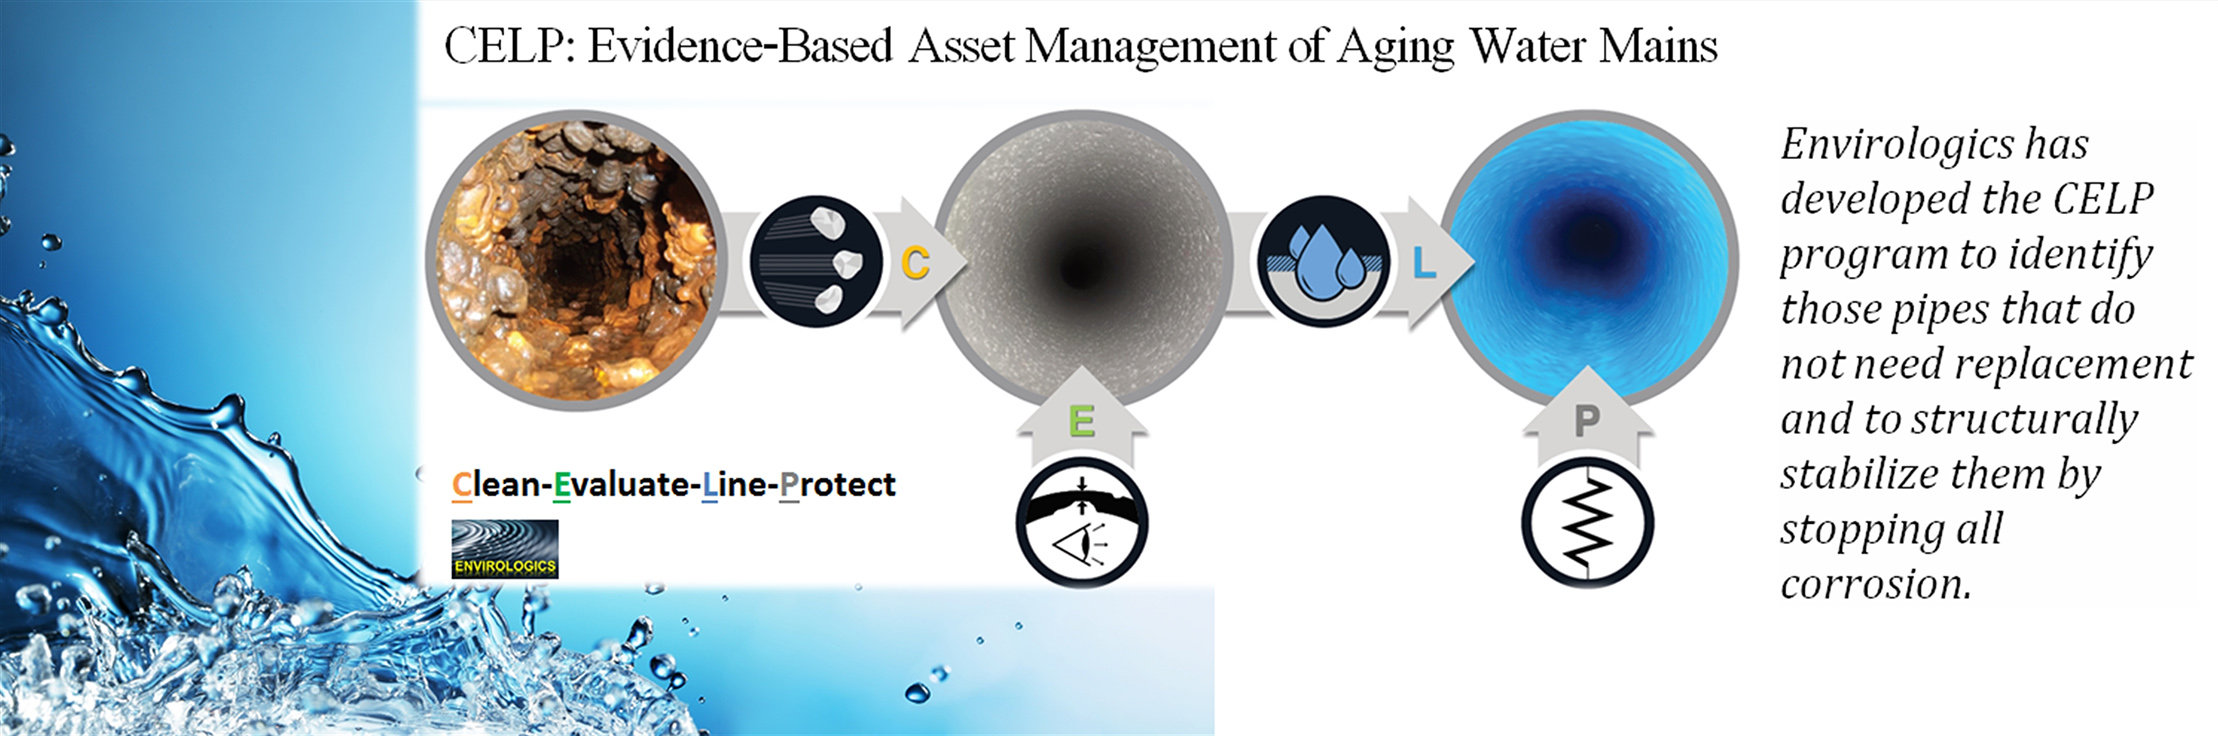
 Evaluate
Introduction to Remote Field Eddy Current (RFEC) Probe Technology
In its simplest form, an RFEC probe consists of two coils in a send-receive configuration. Figure 1 below shows a diagram of a simple RFEC probe in a deteriorated pipe. The exciter coil transmits an electromagnetic field and the detector coil receives a phase shifted, varying strength signal based on pipe wall thickness variations.
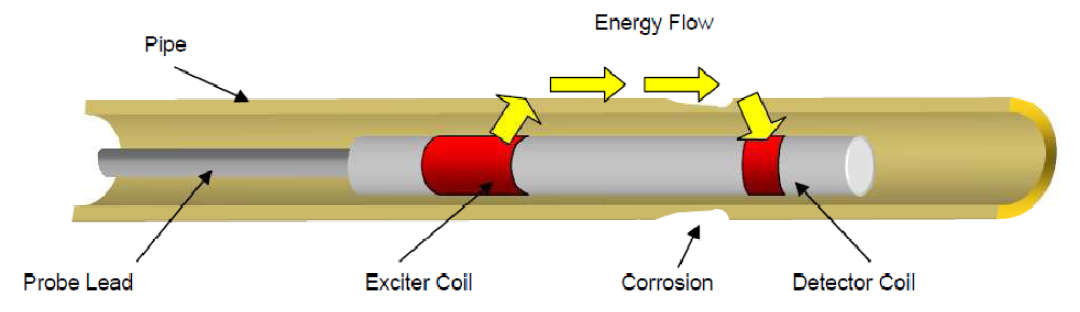
Above, Basic Setup of RFEC probe in pipe.
The electromagnetic field is created by passing a low frequency current through the exciter coil. The field signal then travels from the exciter through the pipe wall, along the outside of the pipe and back through the wall to the detector coil. The signal phase shift and strength variations are analyzed by the probe software to provide anomaly details including pipe wall thickness change. The detector coil is set at a specific distance from the exciter coil (approximately three pipe diameters) and is “remote” enough that the exciter coil does not interfere with the recorded data.
Envirologics Detective Evaluation Description
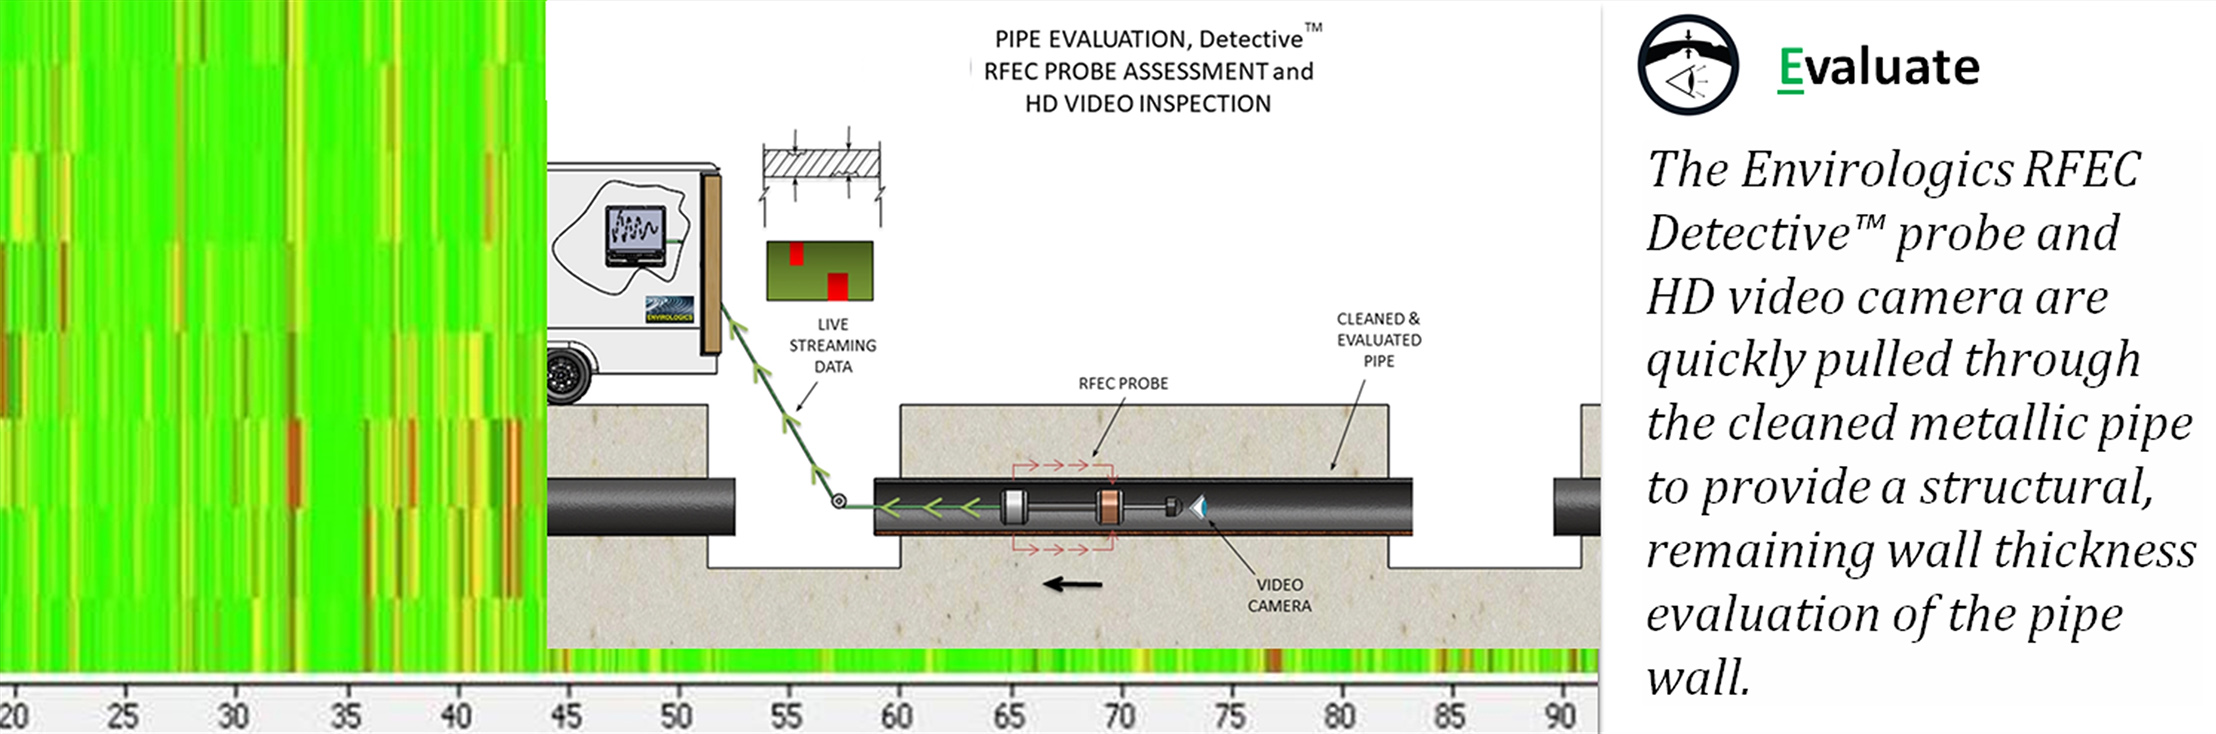
Envirologics has incorporated the RFEC technology into the new Detective™ probe. After the pipe is cleaned, the Detective probe is pulled via the multi-conductor cable through the pipe using a winch system. A video camera is concurrently pulled through the pipe recording a visual inspection of the pipe interior as seen in figure below.
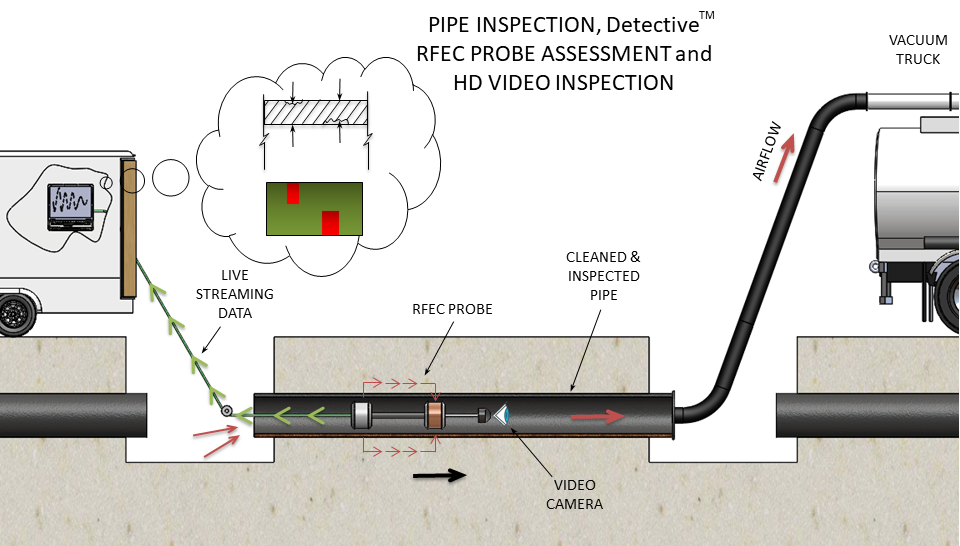 Above, Envirologics Detective evaluation schematic
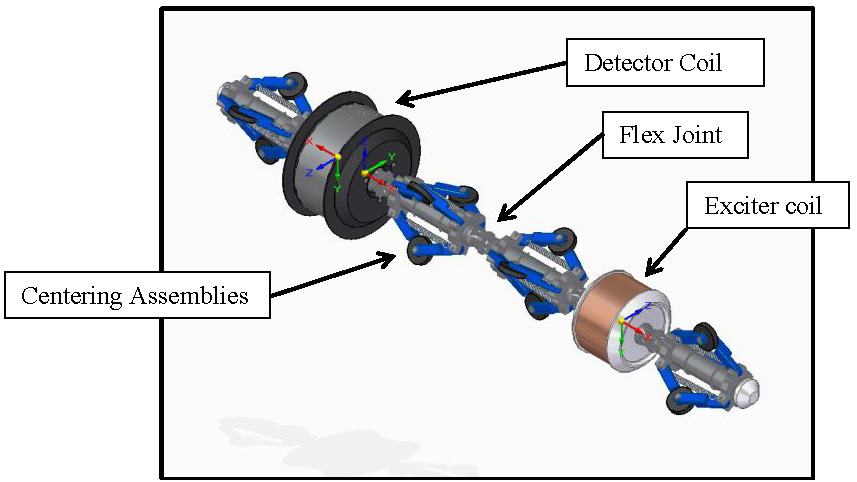
Above, Envirologics Detective RFEC Pipe Assessment Probe
Just like conventional RFEC technology the Detective works by detecting changes in the electromagnetic (EM) field generated by the probe. The EM field interacts with the metal in the encompassing pipe and becomes stronger in areas of metal loss. On the Detective device, the EM field interactions are captured by on-board detector coils and the data is sent “live-streaming” through the multi-conductor cable to the Eddy Current Main Frame processing unit. The data is processed then viewed “live” via the laptop software. Assessment data is stored on the computer for subsequent viewing and analysis.
Assessment and Video Data
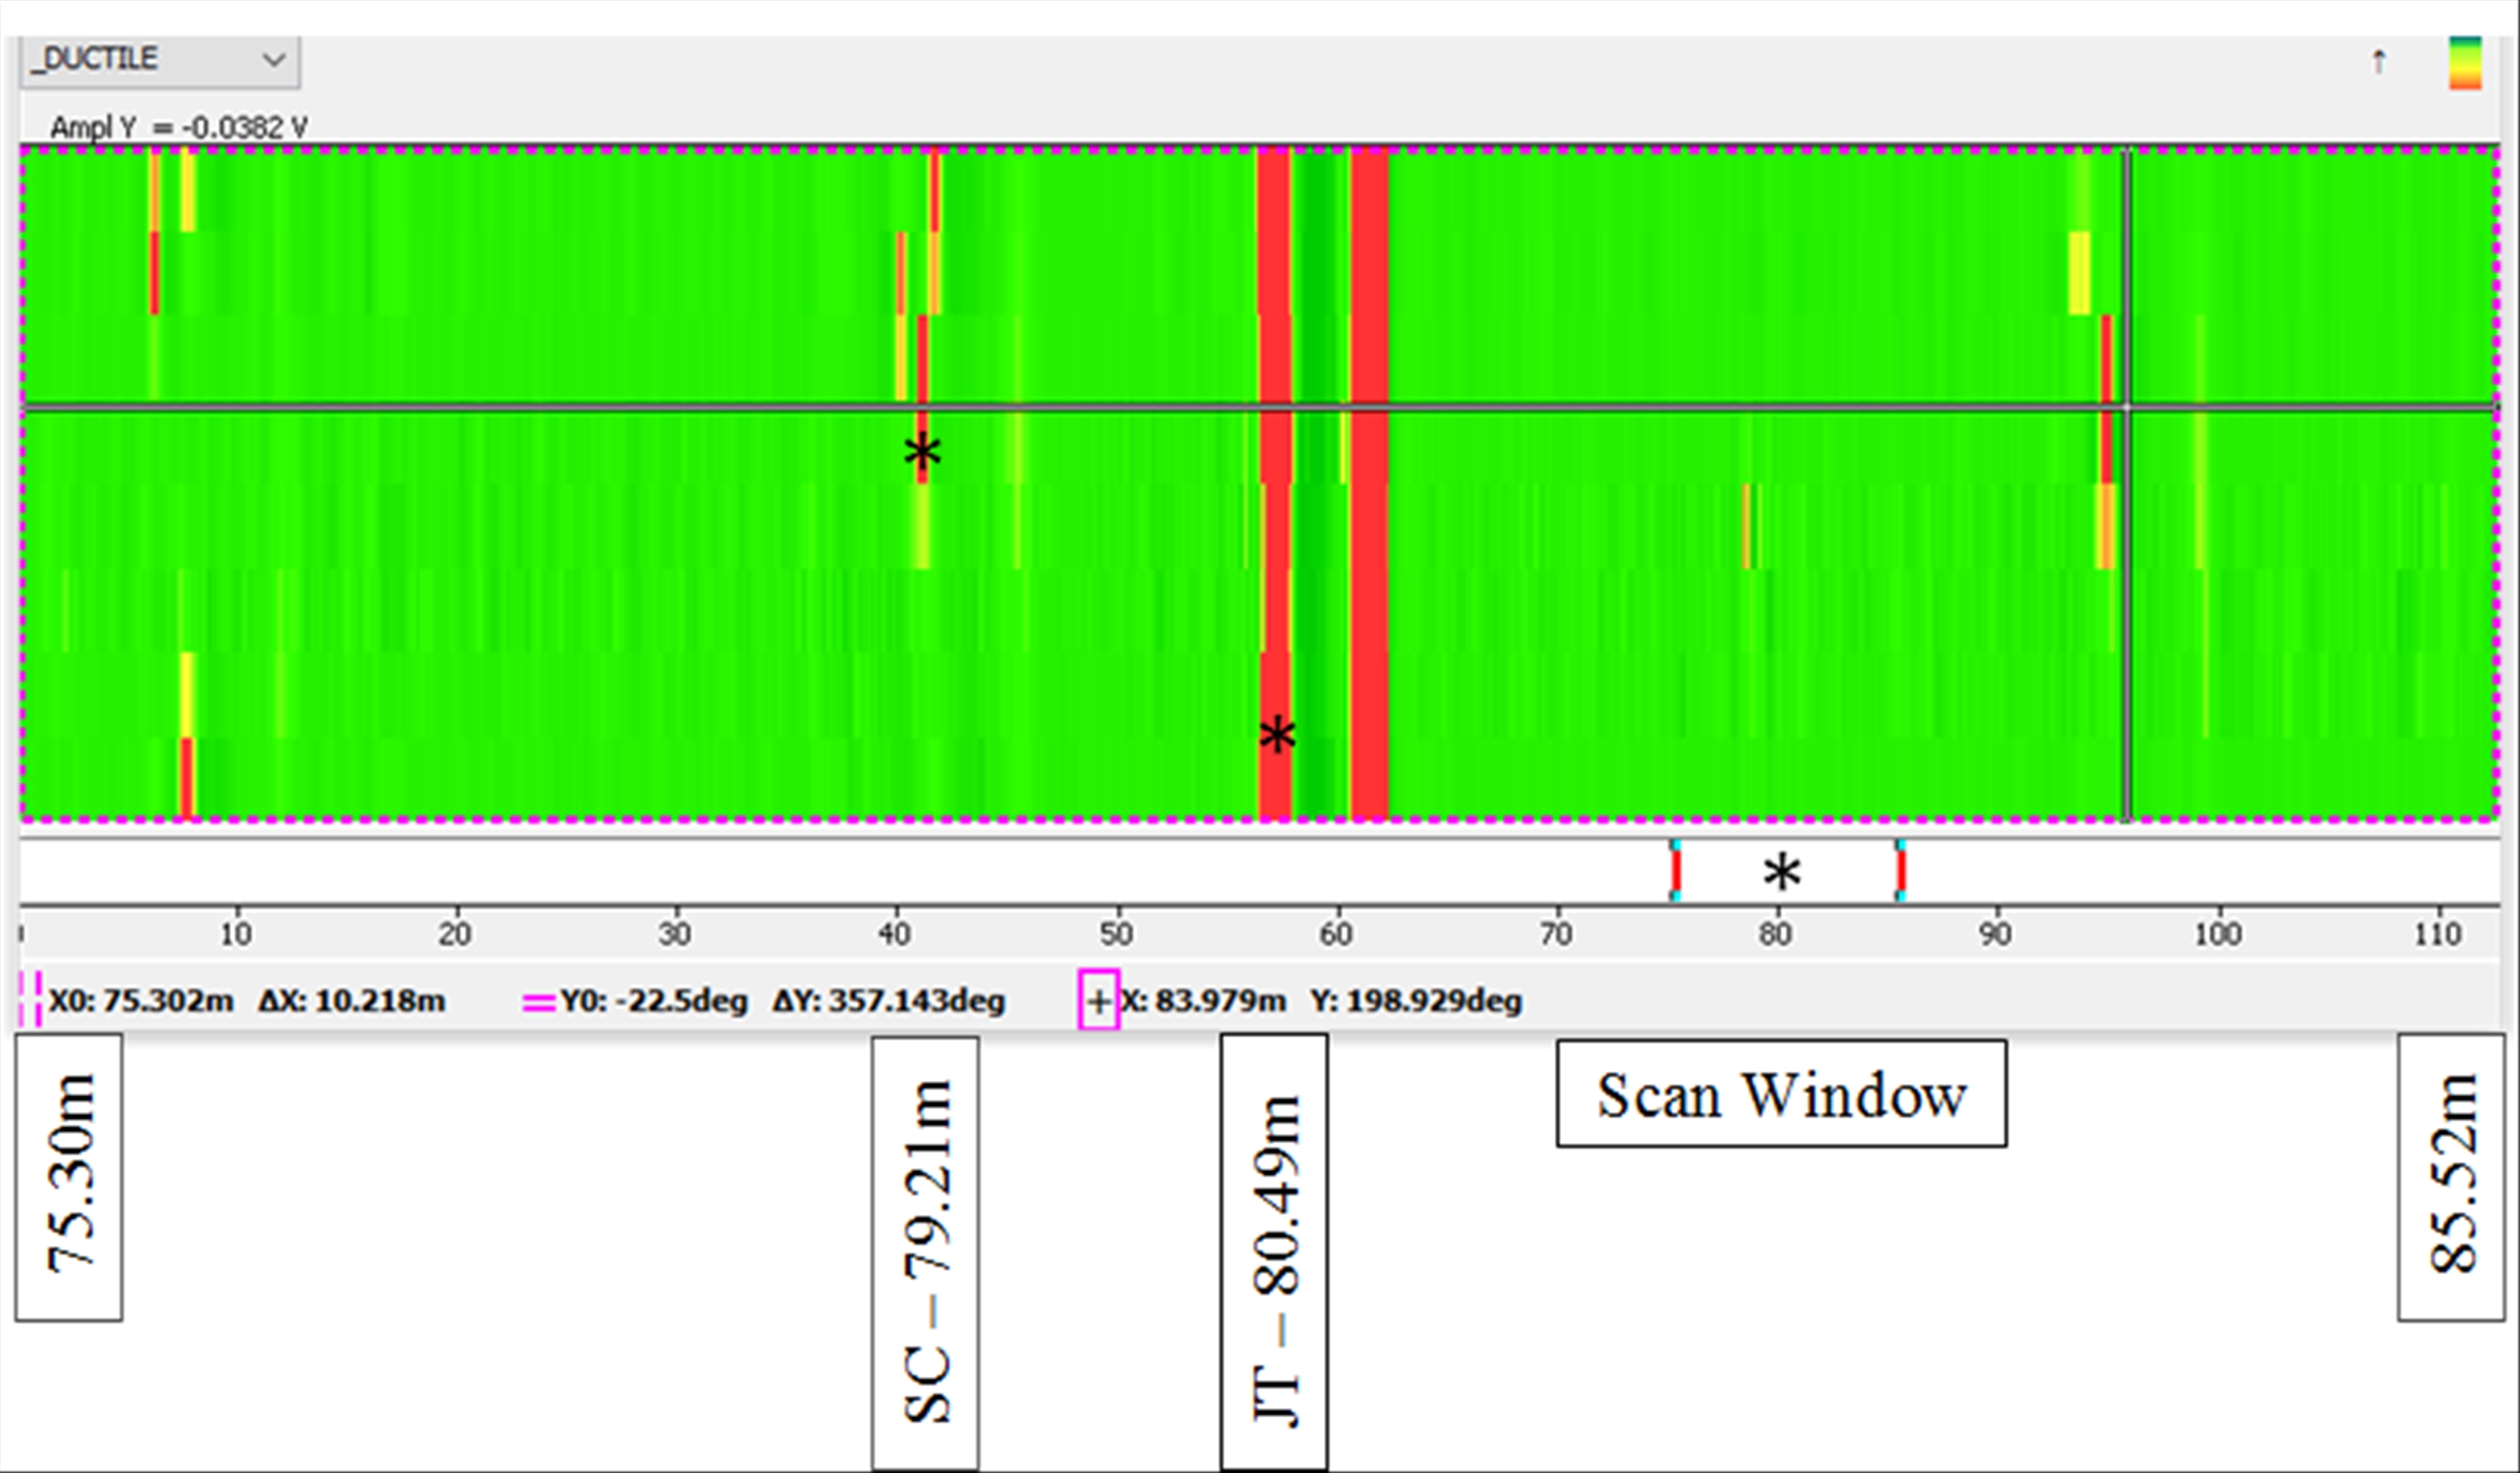
The Detective software provides a simple, colour coded wall loss defects graph on a laptop screen to provide a quick audit of the pipe’s health. The areas of concern are highlighted in red based on defect severity. The threshold can also be changed within the software post scan in order to improve assessment capability.
The concurrently recorded video inspection is used to aid in distinguishing defects (DFT) from pipe joint (JT) and service connection (SC) locations, which are also shown in red on the RFEC scan graph
The simple interface data shown below allows the client to make quick decisions as to next steps in the rehabilitation process such as pipe repair (i.e. internal clamps), class 1 coating, class IV liner application, cathodic protection installations, or dig and replace of the pipe segment.
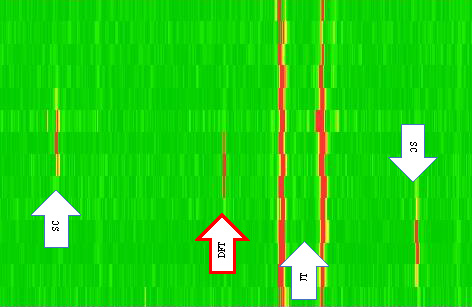
Above, Simplified Detective assessment scan data, SC = Service Connection, JT = Pipe Joint and DFT = corrosion defect.
The pictures below show a defect in cast iron pipe as viewed concurrently by both the video camera and the RFEC probe. These simultaneous evaluation methods have the added benefit of helping to determine levels of internal vs. external corrosion.
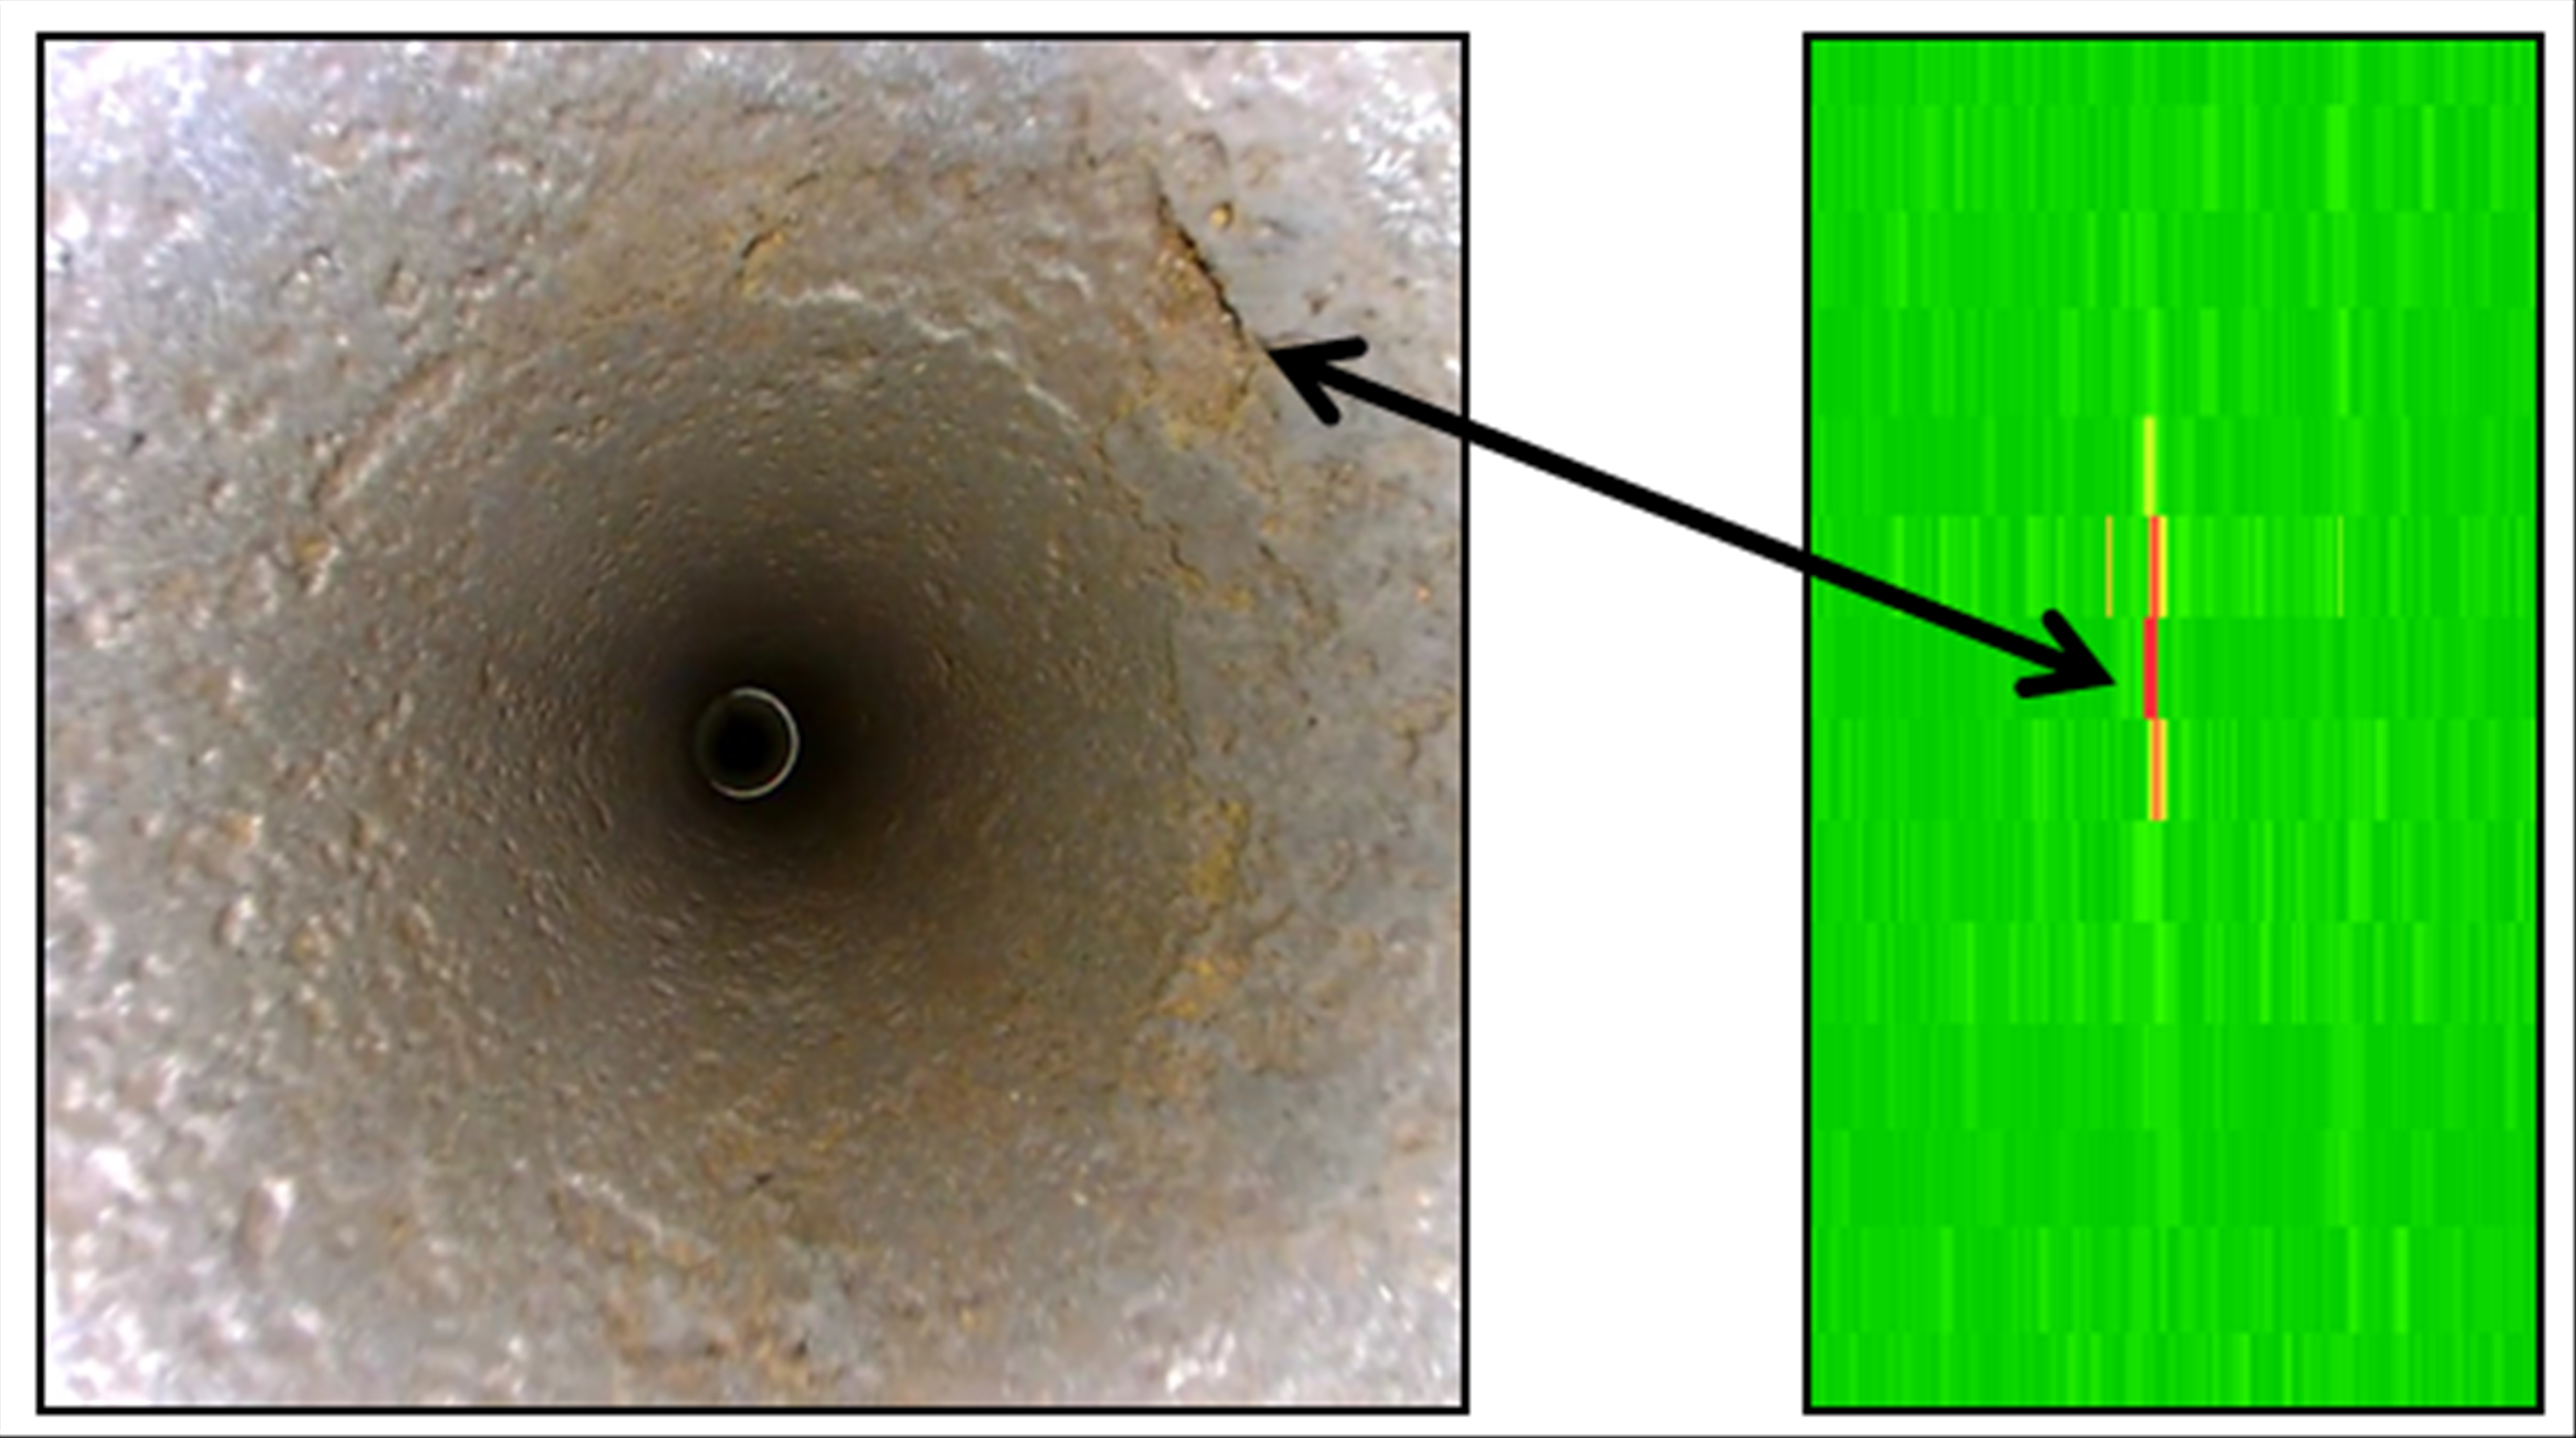
Above, Video inspection of cleaned pipe showing corrosion defect. Right, Probe assessment scan showing same corrosion defect
Below shows an example of assessment data as viewed on the laptop screen with a 50% through wall (TW) color threshold setting at which the data points turn red.
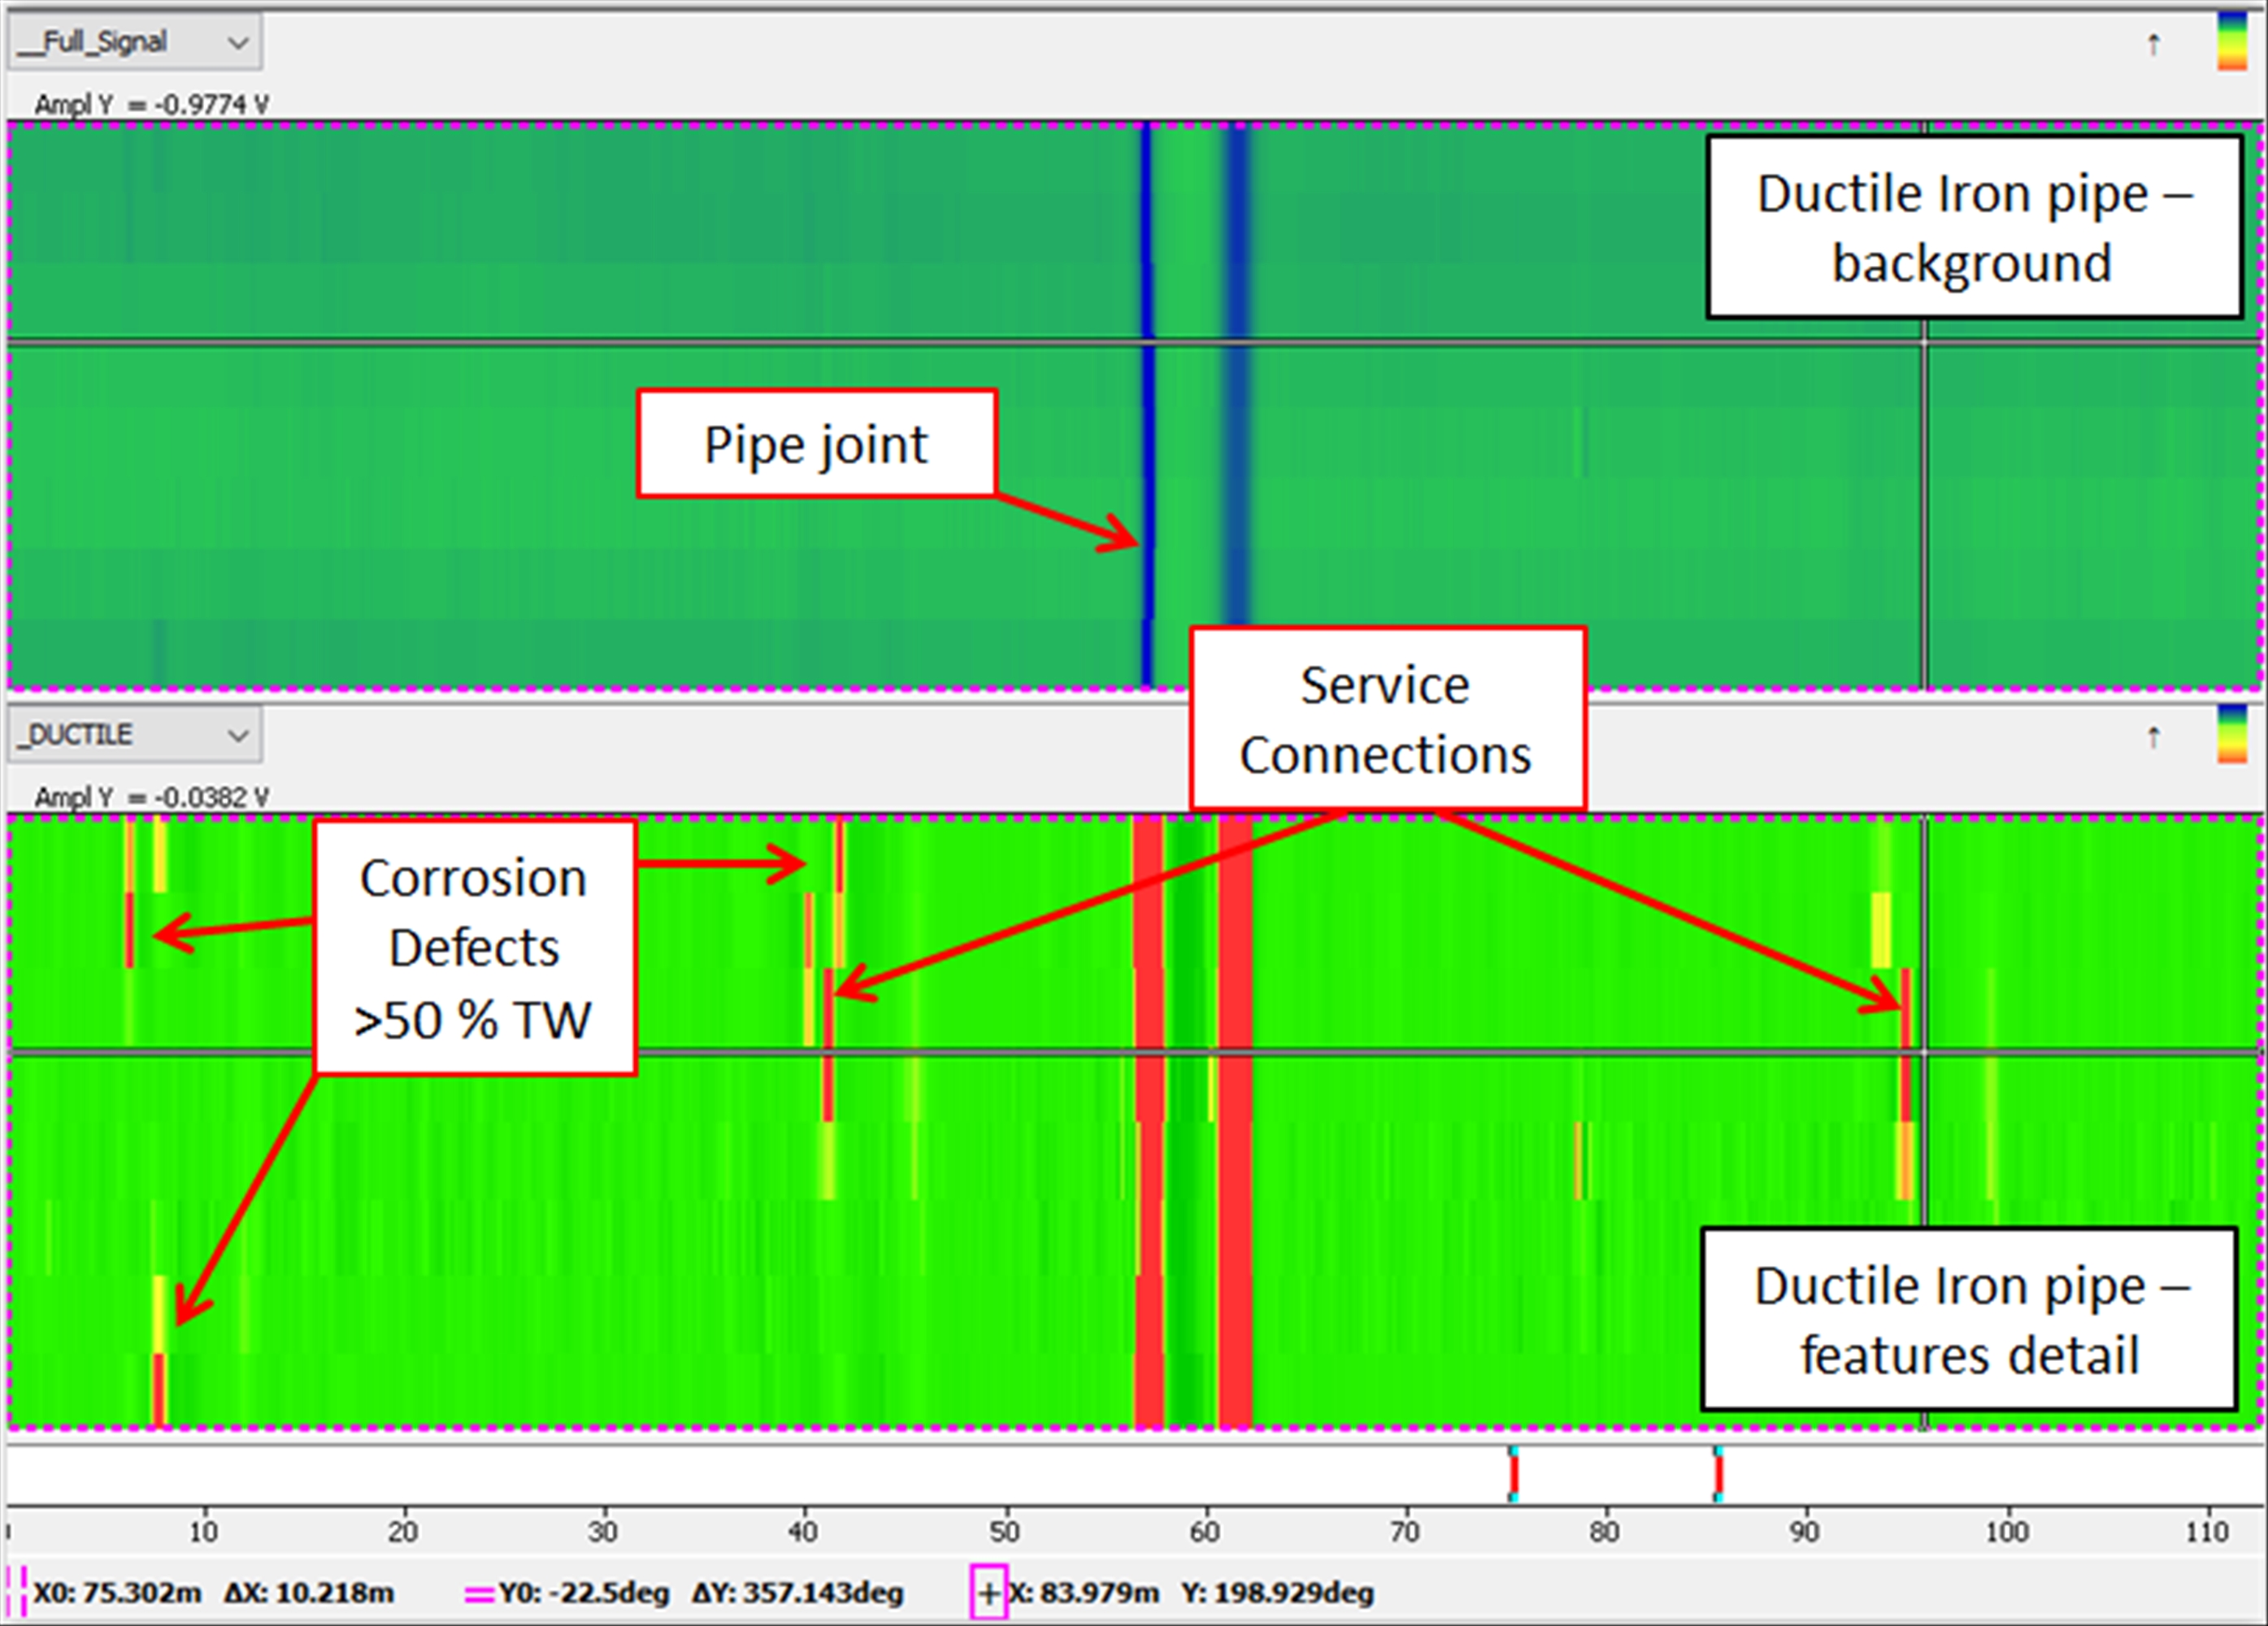
Above, Assessment data as viewed on computer screen, 59% trhough wall (TW) threshold
The figure below is an example of assessment data that will be provided to the customer, indicated locations of joints and service connections.
Above, RFEC Scan data provided in PDF format
Included with the assessment data will be a video inspection log. The log is used to locate such features as service connections, joints, pipe conditions such as leaks that were discovered during the CCTV inspection, etc. The video inspection and RFEC assessment data will be correlated by distance of features starting with 0m = start of pipe scan.
For an overview document that includes the information presented above along with specification, please click here.
Keep checking back to discover the latest developements with our Detective RFEC probe.